

PEN in Phnom PENh
CONTENT:
- Updates: PEN 2009 workshop, PEN presentation, data submissions, and a new PEN doctor
- PEN in Phnom PENh
- Forest dependency: a tale of many numbers
- Good reading: How reliable are own-reported figures?
- PEN projects across the tropics: Ghana and Ecuador
- PENroach dispatch 3: What is under the hood?
- Goodbye rat, welcome ox!
1. Updates
- The penultimate PEN workshop: The 2009 PEN workshop will be held 23rd – 28th March 2009 at the CIFOR headquarters in Bogor, Indonesia. It will focus on partners’ results and global analysis. In addition, two days will be set aside for a writing workshop (led by Peter Frost).
- PEN in the sciencespora: PEN was presented at the World Conservation Congress in Barcelona in October 2008. The feedback indicates an eager community awaiting the results of the global analysis. Poster link: PEN Poster Trees
- Data submission has almost passed the halfway mark: 16 datasets have been submitted, and 7 of these approved after a thorough data checking and cleaning process. A total of 38 are expected to be submitted.
- A new PEN doctor: Miriam Wyman (University of Florida, US) has just defended her thesis on Conservation Initiatives, Community Perceptions, and Forest Cover Change: A Study of the Community Baboon Sanctuary, Belize.
“However beautiful the strategy, you should occasionally look at the results.” Winston Churchill
The single largest cluster of PEN studies is done by the ‘Danida-PEN’ project, a four year (2007-10) PEN based research project with extensive fieldwork in Cambodia, Burkina Faso and Ghana (presented below). Participants of this project met to share experiences, look at some results as well as map the way forward, on 13-17th October 2008, in Phnom PENh. The workshop was hosted by the Cambodia Development Research Institute (CDRI), the partner institute in the country.
Project coordinator Carsten Smith Olsen in his opening presentation quoted Churchill: “However beautiful the strategy, you should occasionally look at the results”. The workshop reviewed the fieldwork experience and satisfactory progress made so far, noting that data collected in general was of high quality. The participants also worked out detailed work plans for the coming year, and established a common foundation on which to approach data handling and analysis.
An extensive report is presented on the PEN website: PEN in Phnom PENh
3. Forest Dependency: A tale of many numbers
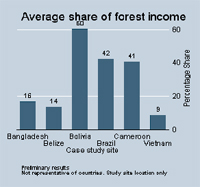 At the PEN workshop in Barcelona earlier this year, we ran a small quiz among the participants: what will be the forest income shares in your study and on the average for PEN? For the global average (the average guess was 22 %), it is increasingly looking hard to predict. The graph gives a quick comparison of some of the datasets that have been submitted. The variation across the sites is staggering (and naturally, the variation across communities and households is even larger).
A key objective of PEN is to better understand this variation. As researchers we should therefore be happy for the heterogeneity found: it helps to get statistically significant results! It also reminds us of STAT 101: averages are just one of many interesting statistics to be extracted from data.
4. Good readings: How reliable are own-reported values?
Most socio-economic studies, such as PEN, use own reported volume and value data for agricultural and forest products. The reliability of these data is often a point of contention. Some argue that respondent tend to over- or under-report for a number of reasons such as suspicion that the data provided will be used in tax assessment, or to keep up with the Jones’s. Or the answers might be wild guesses to please enumerators.
Own-reported values (prices) should vary across households: the units of measurement differ (how many kg is one headload?), products are heterogeneous, and prices vary depending on location, season and household’s market links. The tricky question when very different prices are reported is, of course, whether this variation is due to such legitimate reasons, systematic biases, or just wild guesses by the respondents.
Two forthcoming articles from PEN studies in Nepal and Bolivia show how one can use descriptive statistics to assess how good own-reported figures are. Such statistics include the difference between mean, median and modal values, degree of skewness, and the standard deviation compared to the mean. Both papers conclude that own-reported product values have acceptable properties, indicating that the figures reflect real resource values “rather than being just arbitrary answers provided by respondents who feel obliged to participate in the research”. They also suggest that, for the reasons mentioned above, researchers should use household-level recorded values rather than village averages. Although own-reported values have potential biases and inaccuracies, these errors appear to be smaller compared with the alternative, which fails to capture genuine household differences.
References:
Rayamajhi, S and Olsen, S. C (2009): Estimating forest product values in central Himalaya-methodological experiences. Scandinavian Forest Economics 42, in press.
Uberhuaga, P.C. and Olsen, C.S. (2009): Can we trust the data? Methodological experiences with forest product valuation in lowland Bolivia. Scandinavian Forest Economics 42, in press.
To obtain soft copies of the articles, contact: Carsten Smith Olsen at cso@life.ku.dk
5. PEN PROJECT I: Forest Research Institute (Ghana): Wet and dry
The Danida-PEN study in Ghana is being executed by the Forestry Research Institute of Ghana, Kumasi, and aims to: (i) establish whether local communities’ dependence on forests is significant to their livelihoods, including their role as safety nets, (ii) examine the benefits to local people of forest revenue, (iii) examine the impacts on household income of current resource tenure system and alternative options, and (iv) identify the economic impacts of collaborative forest management arrangements on rural livelihood;
The first objective investigates the relative and absolute importance of forests to rural households, common to all PEN studies, whereas the others will shed light on pertinent forest policy issues in the country. The study is being implemented in two sites in the Wet and Dry forest zones of the country. The wet site is situated in the south western corner of the country, and extends over one district (Wassa Amenfi) and is characterized by evergreen vegetation and a mean annual rainfall of about 2000mm. The population density of the area is in the range of 51-100 people/km2. Cocoa cultivation is a major land use and economic activity, but oil palm and rubber are also important tree crops. Gold mining and logging operations as well as fuelwood collection and charcoal production are other cash income activities. Some government forests reserves at the site have been designated as Globally Significant Biodiversity Areas (GSBAs), and these are being policed by communities.
The dry site extends over three districts (Akumadan, Techiman and Nkoransa) and is located in the transition ecological zone with intergrades of dry semi-deciduous forest and savannah vegetation. This site is characterized by a mean annual rainfall of 1100mm and a similar population density as the wet site. The economy is dominated by a wide array of staple crops: maize, yam, cassava, groundnut, beans, tomato, pepper, okra and garden eggs. Cashew and tobacco are key cash crops in the area. Fuelwood and charcoal production are also major economic activities in this zone. Forests in the dry site are heavily degraded, hence reforestation programmes are common. Community managed ecotourism sites exist in the area, e.g. the Buabeng Fiema monkey sanctuary.
The Ghana PEN study began with the preparation of the country paper and the inaugural workshop in October 2007. Field operations began shortly after, with the selection of study sites in the Wet and Dry sites. Exploratory surveys of the sites were undertaken to gather background information from the forest, agricultural, district administrative offices and traditional authorities and communities as well as establish a good relationship with them. Team preparations, including training of eight enumerators, were conducted in November 2007. Villages were selected based on distance from forests and markets, and forest management options available. Household data is being collected from 660 households (330 per site) in 30 villages/communities (15 per site), with 22 households in each of them. We have factored in a possible 10 % loss due to attrition and elimination of inaccurate household data. Additional questionnaires were also developed to gather data for the three country specific objectives.
The Ghana PEN study has progressed steadily. Data collection for the PEN prototype questionnaires is finished, while data entry for the PEN global database will be completed by the end of 2008. Quantitative data for the country specific objectives will also be completed shortly.
Initial observations suggest that rural people do harvest a wide range of products mainly wood, medicines, food and game from forests. In many cases, however, these are in small quantities. Moreover, restricted access to such products, especially in protected forests such as the GSBAs, is likely to deter respondents from reporting actual quantities harvested for fear of being sanctioned by village GSBA committees. Finally, collecting PEN data may appear a herculean task; enumerators have to walk long distances in rugged terrain to target respondents. Enumerators sometimes stay late in non-illuminated villages waiting for their respondents to return from the farm for interviewing under lantern and phone lights. However, this could be exciting as the enumerator patiently establishes a diagnostic relationship with the households over 12 months to build trust and enhance free and quality information flows.
PEN PROJECT II: Bolier Torres (Ecuador): a global top 10 biodiversity hotspot
The “Sumaco Napo Galeras” National Park (PNSNG) is a protected part of the Amazonas rainforest in Northeast Ecuador. The park was created in 1994 with a total area of 205 249 ha, and is the “core region” of the “Sumaco” Biosphere Reserve RBS (931,930 ha). The estimated population in the tampon (buffer) zone of RBS is about 108 000. This area has been declared one of the world’s 10 “hot spots” of biodiversity. The main problem of this area is the high deforestation rate, which began after road construction following the discovery of oil the late 1960s.
Forests are still important for rural livelihoods in this area; as a direct cash income source and a safety net in times of crises, as well as a source of subsistence for the indigenous populations that mainly consume Non Timber Forest Product (NTFP), including wild animals. Other problems concern high rates of unemployment, deficient educational systems, absence of hospitals, and lack of basic services. In order to deal with these and to diminish the pressure on the natural forests it is necessary to have up-dated and reliable data about the living conditions in the tampon area of the RBS. By applying the PEN prototype questionnaires it is possible to obtain crucial knowledge about the social, economic and environmental components as well as the long-term change of land use and land cover.
The objectives of this research project are: (i) to analyze the local forest use (collection of products and conversion/deforestation) in the Sumaco Biosphere Reserve, including the interaction between poverty and forest use, (ii) to investigate the poverty level of the rural population, and to further understand the role of forests for the livelihood in this area, (iii) to map farmers’ perceptions and attitudes regarding the declaration of Sumaco Napo Galeras National Park, Sumaco Biosphere Reserve, environmental regulations and the technical assistances of the Ministry of Environment as well as national and international organizations, and (iv) to analyze the level of participation of the communities in relation to environmental governances.
The PEN survey process started in April 2007 when PNSNG park rangers were trained to survey 32 of the 270 communities within the tampon zone in the RBS. It turned park rangers into highly effective and engaged surveyors, who consider themselves researchers instead of simple guardians of the PNSNG. Most importantly, park rangers play a decisive role in the socialization process since often they are part of the local communities. Furthermore, 7 of the 13 park rangers speak “Kichwa”, which is essential since about 70% of the communities living in the tampon zone have limited command of Spanish.
Farmers in the RBS are from both migrant (30%) and indigenous Kichwas populations (70%). The agriculture system is mainly cash crops (principally coffee and cacao) and pasture, in addition to food crops (rice, maize, plantain and yucca). Some of these crops are associated with sporadic trees which have naturally regenerated, forming a landscape of agro-forestry systems.
The restrictions during the period of data collection are mainly linked to climatic constraints due to high rainfall and precarious roads, which make access to some communities difficult. All surveys have now been completed. In general, the members of the survey team reported that the response of the communities has been positive and that community leaders have expressed their interest to cooperate with the PEN-RBS study. In this sense, people have shown their concern about the deterioration of the environment and the impact it has on their living conditions.
6. What is under the hood?

One of the dangers of our increasing dependency on close-you-eyes-and-point-and-click software is that we don’t pause to think about the results we are getting; blindly trusting that Computer the Great got it right.
Knowing how the results you are reporting were computed is important unless you plan to publish in the Journal of Irreproducible Results. Some take the business of results so seriously they start from first principles and write programs and algorithms for everything from the most basic regression to more sophisticated analysis. But, not all of us have the time and expertise to do this and thankfully, most good software (Stata, SAS, etc.) will disclose how the results you get are computed in a methods and formula’s section in the manuals, allowing you to at least check that the formula is consistent with the textbook definition.
If you think this is trivial, here are a few interesting pieces that hit very close to home (the analysis of PEN data). The first is a paper titled the Quartile Conundrum. The abstract speaks for itself
Calculating quartiles is a common task that can be accomplished in multiple ways, but not all calculations return the same results for the same data. There are many definitions of a quartile as well as multiple descriptive terms (percentile, quartile). The challenge for a programmer is in determining which code to use. This paper will offer, to both new and seasoned programmers, the awareness that understanding what you are being asked to provide regarding quartiles is just as important as knowing how to provide it.
The rest of the paper is here http://www.nesug.org/proceedings/nesug08/po/po03.pdf. The second piece is also on percentiles and provides a useful comparison that include the ubiquitous excel http://www.data-for-all.com/documents/computing-percentiles.pdf. Finally, here are eight (yes, that is correct 8) ways to compute quartiles http://www.resacorp.com/quartiles.htm, or five if it makes life easier http://groups.google.com/group/sci.stat.math/browse_frm/thread/9f731224de2d1a54.
Having read these, you will never again think that calculating the forest income share for the bottom 20 % of the households in your is straightforward.
And the moral: know what is under the hood.
7. Goodbye rat (? ?), welcome ox (? ?)
In the last PENEWS of 2007, we mistakenly thought that 2008 – the year of the rat according to the Chinese calendar – was the perfect fit to PEN. The rat is – as all will recall – “charming, passionate, charismatic, practical and hardworking, …, endowed with great leadership skills.” But, now we know better: 2009 (or at least the year starting 26. January 2009) is the year of the ox. This animal is the sign of prosperity through fortitude and hard work. It has all the ingredients we need as PEN move into a year focused on data management, analysis and writing: “Dependable, calm, methodical, patient, hardworking, ambitious, conventional, steady, modest, logical, resolute, and tenacious.” The flip side is that this year (and people born in the year of the ox such as Obama), “can be stubborn, narrow-minded, materialistic, rigid, demanding.”
We wish everyone a happy and prosperous new year!
Arild Angelsen, PEN coordinator
Ronnie Babigumira, PEN Research Fellow


